top of page

Chart Types
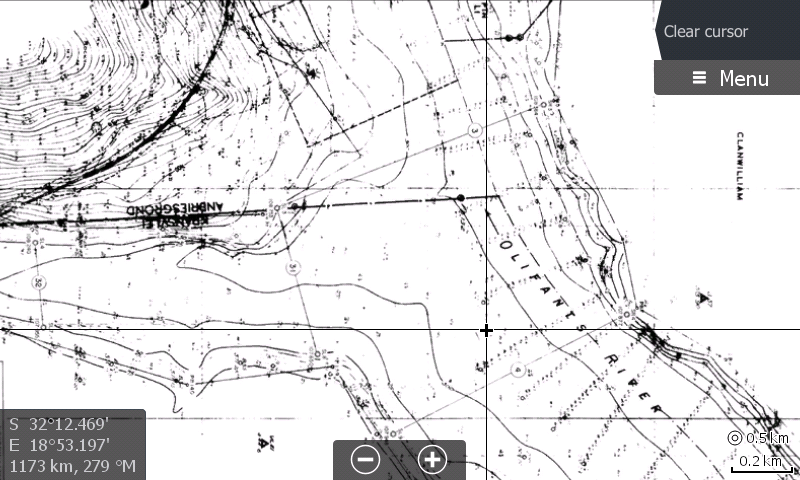
Contour -
Contour charts are as the name implies, contours showing the topography of the structure below the water such as river channels, humps, ledges, points, bars, coves etc. Understanding contour charts is the very basis of learning a body of water, even if you only fish the banks. The structure leading up to that shoreline will determine how the fish will relate to that bank, giving you a 'heads-up' on where to make a few extra casts rather than just 'bashing blind'.
FishTec uses the latest in technology to capture this data by physically driving it out using sonar as well as an autonomous craft which was designed and built by John Easton for covering medium bodies of water with great accuracy and quality data.
Here is a great article - A Beginners Guide to Understanding Map Contour Lines

Understanding Contours
Click on link to read a great article on understanding contours.

shot087

Contour Overlay
The contours can be turned on and off over images under Chart Options / View / Categories
Understanding Contours
Click on link to read a great article on understanding contours.
1/13
Hardness -
Bottom hardness is data collected from the intensity of the echoes while collecting contour data using sonar. This is very handy information when it comes to identifying key points of interest when planning a fishing trip.

shot089

bottom

shot013
shot089
1/4
Sediment -
Sediment charts are the next level of topography charts as they sometimes include critical information such as rocks, trees and man-made objects from building foundations, roads, bridges and even footpaths that contribute critical detail to potential hotspots.
Sediment Plain

Colour Sediment Hybrid
Many of our charts include colors to identify key cover and sometimes include a satellite shoreline.

Sediment Hybrid
Many of our charts include colors to identify key cover and sometimes include a satellite shoreline.
Sediment Plain
1/12
Satellite -
Satellite Imagery is a great help, especially using the imagery history, which if we are lucky, will capture not only when the dams or lakes are full, but when they are low during times of drought revealing some very interesting features. In some cases, even before the dam wall was built or raised

Tzaneen Dam

Tzaneen Dam Low Level
Tzaneen Dam
1/2
Mosaic -
Mosaic imagery is created using high-definition side-scan sonar to create a lifelike representation of the bottom where sonic shadows add a 3D like view, very much like a Shaded Relief chart. Not only is key cover highlited, but it adds much more detail to the bottom structure that general bathymetry or land surveys for sediment charts would otherwise miss. The strength of the return also highlights the harder and softer sections of the bottom, also key to identifying fishing hotspots. Please note that only fishing related areas are generally covered. The recent mosaics are usually 2 - 3 times the resolution of StructureMap for example.

shot017

shot015

shot002
shot017
1/17
UltraHF -
Ultra High-Frequency side scan sonar is used to create a far more detailed mosaic, revealing those small details required when fishing very tough conditions. In this image below we have used a photo editor to insert a boat with a shadow to emphasize the detail and scale in proportion. Many charts have great detail when zoomed out, but when you zoom in, the detail is lost. This is NOT the case with UltraHF, you can zoom in all you want without losing resolution.

AerialHD -
AerialHD is data that is captured using a drone with a very high spec HD camera of areas where the water level has dropped during droughts for example. The resolution is around 20X that of satellite imagery for example.

Elevation -
Elevation is a form of 'Light Distance Ranging' which creates a 3D ShadedRelief with contour data 50X that of traditional sonar contours, and once again, no matter how much you zoom in, the resolution never stops improving.
In this slide gallery below, you can see the wooden jetty on orange, indicating that it is a very tall object off the ground, which you can see in the Panoramic Image Viewer. Without the Elevation view it will be hard to tell from directly above the object how tall the object is.

Screenshot_2017-09-17_02.02.52

Screenshot_2017-09-17_02.03.13

Screenshot_2017-09-17_02.03.47
Screenshot_2017-09-17_02.02.52
1/3
bottom of page